What the MySoloPool Dashboard Actually Teaches You About Bitcoin Mining
The MySoloPool dashboard is basically a window into how your miner talks to the pool. Watching it live for a while is honestly one of the fastest ways to understand what Bitcoin mining really is under the hood.
I remember the first time I pointed a small hasher at MySoloPool and just sat there staring at the dashboard. I didn’t plan to, but I ended up watching it for almost an hour. Every few seconds a new share would land, a number would jump, and somewhere in the background a tiny green flash would tell me the machine had sent in another proof of work. You stop reading about mining at that point and you start seeing it.
That is really what this page is good for. If you are new to Bitcoin mining and you want a real, hands-on way to understand how a miner communicates with a pool, the MySoloPool dashboard is one of the clearest teaching tools out there. No signup, no weird portal. You paste your BTC address, open the dashboard, and the story starts writing itself in real time.
What you are looking at in the first few seconds
The top of the dashboard is mostly status cards. Current hashrate, average hashrate over the last 24 hours, how many shares the pool has accepted, and how many got rejected. These are the numbers people usually talk about in YouTube videos, but seeing them tick live is a different thing. You notice the current hashrate isn’t flat. It breathes. It dips when a share gets delayed, it jumps when several workers submit at once. The 24h average quietly smooths all of that out.
There is also a small indicator that shows when the last share came in. If you have a single machine running, you will watch it reset every couple of seconds. That rhythm, that small heartbeat, is your miner talking to the pool. Each tick is basically your ASIC saying “hey, I found a partial solution, does this count?”
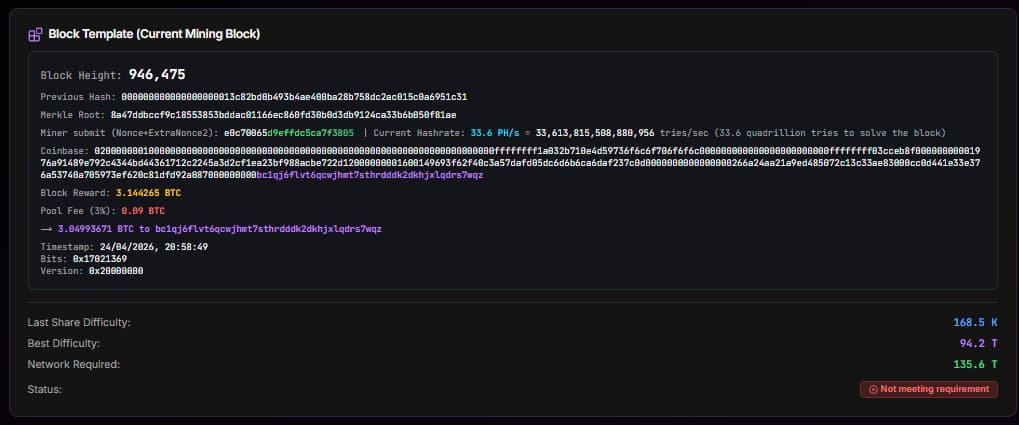
Shares, accepted, rejected: the quiet conversation
A share is a piece of work your miner did that almost solved the block. It didn’t hit the network target (that’s the jackpot), but it hit a lower target the pool sets, which is enough to prove you were actually hashing. When the pool writes back “accepted”, it means: yes, we checked your proof of work, the math is valid, thank you, keep going. When it says “rejected”, something was off — usually the share was stale (the pool already moved on to new work) or your miner was on the edge of connectivity.
The reason this matters for learning is that you can literally watch the protocol work. Stratum isn’t magic. It is a back-and-forth where the pool hands your miner a block template, your miner brute-forces variations, and when one of those variations meets the difficulty target, it gets shipped back. The dashboard is just rendering that conversation in friendly numbers.
Best difficulty vs last difficulty: what each one really means
Two fields usually confuse people the first time. Best difficulty and last difficulty. They sound similar but they tell completely different stories.
- Last difficulty is the difficulty of the most recent share you submitted. Think of it as: how hard was the last problem my miner just solved.
- Best difficulty is the hardest share you have ever landed since mining on the pool. Your personal record. Every once in a while you beat it, and that number crawls upward.
If you want a feel for where the network is, compare your best difficulty to the current network difficulty shown at the bottom of the dashboard. That gap between your personal best and the network requirement is, in one glance, your distance from solving a real block. It is humbling and addictive at the same time.
Real speed, live mining, and what the chart is really drawing
Further down the dashboard you will see the hashrate chart. On MySoloPool this is a 24-hour rolling view of how much real work your miners have been producing, calculated from accepted shares. It is not marketing hashrate. It is not name-plate TH/s. It is measured from your actual submissions.
That distinction is huge for beginners. The first lesson most people learn from watching this chart for a day is that your miner does not always hash at its rated speed. It has warm periods and cold periods. It might slow down when your room is hot, or when the wifi glitches, or when the firmware throttles. If you bought a machine expecting a flat line and you see something that looks like a heart monitor instead, that is totally normal — and the dashboard is why you found out early.
Workers table: one row per machine, one story per row
If you run more than one miner, the workers table becomes the most useful part of the whole page. Each worker shows up as a row. You see its hashrate, its last difficulty, its best difficulty, when it last submitted, and whether it is online or offline right now. This is where you notice the unit that is secretly dragging down your fleet.
One S21-class machine will usually keep pace with the others. When a row suddenly reports zero and goes grey, that is your real-world signal to go check the power strip, the LAN cable, or the temperature. You learn to read a fleet this way faster than you would from any textbook.
Why this is genuinely a great way to learn mining
Most mining explainers try to teach you proof of work with analogies — lotteries, coin flips, dice rolls. They work for the idea, but they’re thin. The MySoloPool dashboard shows you the actual thing. You see your hardware working. You see it being rewarded for each valid attempt. You see which attempts were good enough to count and which were too slow. And you watch your difficulty record climb, one small personal best at a time.
If you are still deciding whether to try solo mining, you can point a small amount of rented hashrate at the pool and just watch. The rent-hashrate page on Hashrate Farm is a low-commitment way to do that. No hardware on your desk, no noise, just a dashboard slowly explaining what mining is actually doing every second.
Pro tip: Open the dashboard on a second monitor while you work. After a day or two you will stop needing anyone to explain stale shares, vardiff, or why 270 TH/s sometimes looks like 250. The page teaches you.
FAQ
Do I need an account to see my stats? No. The dashboard keys off your Bitcoin address. Type it into the search and you are in.
Why does my hashrate on the dashboard look lower than the sticker on the miner? The dashboard measures hashrate from real accepted shares. Dust, brief disconnects, and rejected shares will always pull the measured number a little under rated spec.
Is this useful if I am not mining yet? Yes. You can search any active address on the dashboard and watch a real miner’s data. It is one of the cleanest ways to learn what Bitcoin mining really looks like minute to minute.
Related Resource
Solo Pool Setup Guide: Stratum URL, worker format, and vardiff settings for ASIC miners.
Tags
Author & editorial standards
Written by Admin. Content is reviewed under our editorial policy for accuracy, operational clarity, and transparent sourcing on mining economics and hardware.
Continue This Topic
Mining Playbooks
Execution-focused frameworks for miner selection, hosting, and scaling decisions.
Trust Center
Transparency, support standards, and platform reliability principles.
Firmware Library
Find tested firmware resources and maintenance references.
Solo Mining Playbooks
Operational solo-mining guides with failover and variance discipline.
Related Posts
MySoloPool Multi-Coin Solo Pools: BTC, BCH, LTC+DOGE, and ZEC Under One Brand
MySoloPool runs solo lottery stratum for Bitcoin, Bitcoin Cash, merged Litecoin+Dogecoin, and Zcash. One philosophy: wallet-as-username, fee on block find, live dashboards—pick your algorithm.
Zcash Solo Mining on MySoloPool: Equihash Setup for Z15 and GPU Rigs
Point Equihash miners at zec.mysolopool.com with your ZEC address as worker. Vardiff on :3330, NiceHash rentals on :3331, 3% fee on block find, live stats at zcash.mysolopool.com.
Merged Litecoin and Dogecoin Solo Mining on MySoloPool (L7 / L9 Guide)
One Scrypt stratum URL mines Litecoin and Dogecoin together. Use your LTC address as worker—DOGE pays to the matching address automatically. 20% LTC fee on block find, 0% on DOGE.