Bitcoin Price Falls Again - Mining Profitability Impact
Bitcoin fell 5% in 24 hours, squeezing miner margins. See what changes for revenue/TH, break-even power costs, and practical steps to stay profitable.
Bitcoin Falls 5%: Mining Profitability Impact
Bitcoin fell 5% in 24 hours, squeezing miner margins. Here’s what changes for revenue/TH, break-even power costs, and practical steps to stay profitable.
Analysis as of January 21, 2026.
Executive Summary (Bitcoin falls 5% in 24 hours)
Bitcoin falls 5% in 24 hours, which typically reduces miner revenue per TH by roughly the same percentage unless fees spike.
With fees currently low and network competition high, the biggest risk is margin compression for higher power-cost miners. Focus on efficiency (W/TH), uptime, and disciplined power pricing.
Current Market Situation
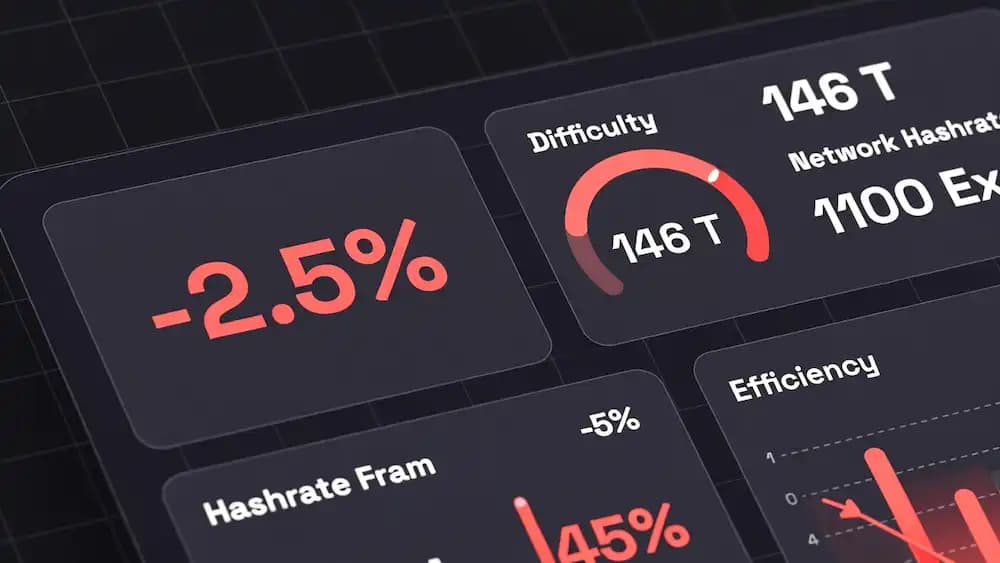
BTC is around $89,023 (about -5% over 24h). Network competition remains intense at roughly ~1.0 ZH/s (≈1,000 EH/s) on a 7-day view, while difficulty sits near ~146.47T after the Jan 10 adjustment (a small dip).
Transaction fees are muted: typical recommended fees are roughly ~1–3 sat/vB, limiting fee “cushion” for miner revenue.
Data notes
- Price snapshot: spot market level and 24h change at time of writing
- Network metrics: difficulty level and recent adjustment; hashrate shown as a rolling average estimate
- Fees: mempool fee-rate guidance (sats/vB), not a guarantee of fee revenue
Impact on Mining Profitability
A 5% price drop is a direct hit to fiat-denominated mining revenue if your BTC production stays constant. In practical terms, margins tighten first for miners with higher all-in power costs (e.g., >$0.07–$0.10/kWh depending on fleet efficiency), older ASICs, and sites with frequent curtailment or downtime.
Warning: When fees are low, subsidy-only economics dominate—so efficiency (W/TH) matters more than pool “luck.”
Geography matters mainly through power structure: fixed-rate retail power is less flexible during drawdowns than industrial tariffs, behind-the-meter generation, or demand-response programs.
Quick break-even framing
| Miner profile | What the -5% move changes | Best lever |
|---|---|---|
| Efficient fleet, low $/kWh | Lower cushion, usually still positive | Tuning + uptime discipline |
| Mixed fleet, mid $/kWh | Some units approach break-even | Per-model profitability switching |
| Older ASICs, high $/kWh | More hours below cash-cost | Shut-off thresholds + power renegotiation |
What to Expect (Next 1–3 Months)
Watch difficulty adjustments, network hashrate trend, and whether fees recover—these three factors drive revenue per TH more reliably than headlines.
If hashrate stays elevated, difficulty can remain sticky, prolonging margin pressure. If less efficient miners power down, difficulty can ease, partially offsetting price weakness without needing a fee spike.
Action Items for Miners
- Recalculate break-even: update $/kWh, W/TH, pool fees, and uptime; use the Hashrate.farm profitability tools to model per-rig outcomes.
- Enforce shut-off thresholds: define a cash-cost floor (power + hosting + ops) and curtail unprofitable hours.
- Optimize efficiency: undervolt/underclock where stable; prioritize cooling and PSU health to protect W/TH.
- Reduce variance: review payout schemes and pool performance; keep monitoring so downtime doesn’t erase thin margins.
Pro Tip: Treat profitability like a process: weekly cost audits + per-model tuning usually beat one-time “set and forget” changes.
FAQ (Mining Economics)
Does a 5% BTC drop mean my BTC mined drops 5%?
No—your BTC output depends mainly on your hashrate share, uptime, and difficulty. The 2.5% drop mostly hits fiat revenue and profit margins.
What metric should I check first today?
Revenue per TH vs. your all-in cost per TH (power, hosting, pool fees, and downtime). If the spread is thin, prioritize efficiency and curtailment rules.
Suggested Charts (for the post)
- BTC price (7D) with a marker: highlight the -5% 24h move on Jan 21, 2026.
- Difficulty (90D): show the Jan 10 adjustment and the current ~146.47T level.
- Fee-rate bands (7D): plot recommended sat/vB ranges (1–3 sat/vB) to illustrate low-fee conditions.
Tags
Author & editorial standards
Written by Admin. Content is reviewed under our editorial policy for accuracy, operational clarity, and transparent sourcing on mining economics and hardware.
Continue This Topic
Mining Playbooks
Execution-focused frameworks for miner selection, hosting, and scaling decisions.
Trust Center
Transparency, support standards, and platform reliability principles.
Profitability Calculator
Model downside risk and break-even scenarios with current assumptions.
Hosting Options
Compare managed hosting trade-offs and infrastructure fit.
Related Posts
Why Crypto Mining Is the Smartest Investment During Wartime
With wars in the Middle East and rising global tensions, traditional financial systems are under pressure. Crypto mining offers a censorship-resistant, borderless way to generate digital assets directly from the blockchain — no banks, no restrictions, no intermediaries. Learn why mining is the ultimate hedge in uncertain times.
Bitcoin Network Hashrate Hits a New All-Time High Update
Bitcoin network hashrate set a new ATH near 1.44 ZH/s, pushing difficulty higher. Here’s what miners should adjust to protect efficiency and margins.